How to find top memory or CPU consuming process in linux

There are many ways to find this but quick and widely used method will be using top or ps command.

  1. Using top command

Find the top memory consuming process using top command

top -o +%MEM | head -n 20

Similarly, if we have to find top CPU consuming process, command will be

top -o +%CPU | head -n 20

2. Using ps command

Find the top 10 memory consuming process using ps command

ps aux –sort -%mem | head -n 10

Similarly for finding top cpu consuming process, command will be

ps aux –sort -%cpu | head -n 10

How to find which vmnic is VM connected to in ESXi

Sometimes there is a need to find which physical NIC is VM connected to in ESXi server. Below i am listing two quick methods to find these. There may be other ways also.

  1. First method using esxtop. SSH into Esxi server. Then type “esxtop”. Then press ‘n’ to get networking view. In the third column under ‘Team-PNIC’ , you will see vmnic number associated with VM name.

2. Second method is finding World ID number of VM and then finding vmnic details using World ID.

a) World ID of a VM can be find by running command “esxcli vm process list” from SSH session of ESXi.

b) Then run the command esxcli network vm port list -w <world id number>. Here world id number is number of VM we want to find vmnic for.

vmfsfilelockinfo – tool to check which host is holding locks on vm files.

vmfsfilelockinfo is inbuilt tool on ESX server to check which host is holding the lock on VM files. To prevent concurrent changes to virtual machine files, ESXi host establish locks on virtual machine files. Once we vmotion virtual machine from ESX host A to ESX host B, then that host B holds the lock of virtual machine. It can be verified by running vmfsfilelockinfo command.

How to run this command. ?

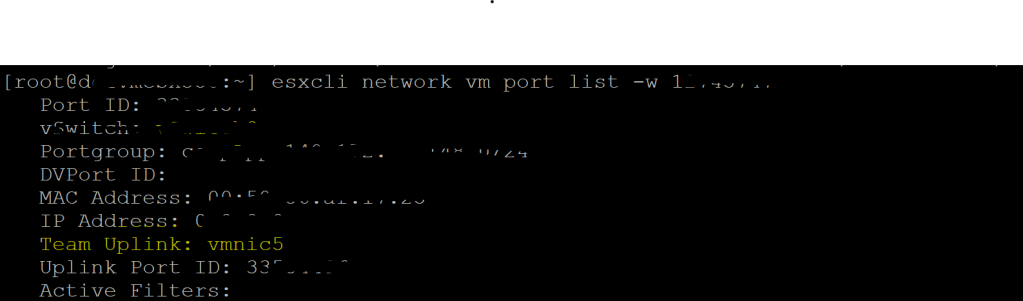
First we have to ssh into ESXi host using root. We can run this command by running command “vmfsfilelockinfo -p /vmfs/volumes/<location of vm files>/<vmname.vmx”.

Please note with this command, it will only look for ESX hosts in the same cluster as ESX host on which you are running this command from. If we want to search all the ESX hosts in vcenter which are holding the locks , then we need to run “vmfsfilelockinfo -p /vmfs/volumes/<location of vm files>/<vmname.vmx -v <vcenter name or IP> -u <local administrator username of vcenter>”

Why we need to know which ESX is holding the lock?

In some rare situations, VM is on ESX host A but we find out by running the command above that ESX host B is holding the locks. In that scenario, we will likely not be able to power on VM if it is power off. Now question is why this happened? In our case this happened because we took some storage level snapshot on storage LUN on which VM files were residing. At that time, VM was on ESX host B which means ESX host B was holding the lock that time. After some time, DRS move the VM from host B to Host A which means host A should technically be holding VM files lock. Now for some reason we had to shut down the VM and restore the VM from storage snapshot. After restore, though VM was running on Host A now but VM files lock was found to be holding by host B ( as per time of storage snapshot) . We can verify that by running the above command. To overcome this situation, we can either a ) reboot ESX host B so that it releases the lock or b) unregister VM from vcenter and using ‘.vmx’ file register VM again , this time on Host B which was still holding the lock on virtual machine files.

This KB article provides much more information on same topic.

https://kb.vmware.com/s/article/10051

How to calculate VM growth rate using vRealize

Often times we need to calculate VM growth rate over a period of time.There are many ways to do this and couple ways to do it in vrealize itself. Below are the steps.

  1. Open up vRealize operations manager. First we will start by creating a new view. Go to Dashboard – > View -> Create a new View.
  2. Provide a name for your view.

3. Under Presentation, select List

4. In Subjects, select vCenter Server under vCenter Adapter.

5. Under Data, select Total Number of VMs under Summary. Label Metric Label as Current.

6. Next , we will show how many VMs have been added over a period of 1 year. Add the same label ‘Total Number of VMs‘. Change the Metric label to 12 Month VM Growth. Change the transformation to Expression and type in expression formula (current-first).

7. We will display Average VM growth per month over a period of 1 year. Add same label again ‘Total Number of VMs’ and this time change label to ‘Average VM Growth’. Change the transformation to Expression and type in expression formula (current-first)/12.

8. Since we want to see the data from last 1 year, under Time Settings , we will change the Relative date range to Last 1 year.

9. Save the view. View is now ready to be added as dashboard or Report.

How Mac address leaning works in physical switch v/s VMware vSwitch

Physical Switch: When a switch is first powered on, the MAC address table is empty. The switch will build MAC address table and only learn from source mac address. Lets say there is switch with 3 servers connected to it. All the servers will have real mac address but for sake of explanation lets assume there mac address are AAA,BBB and CCC respectively ( screenshot below).

Server A is going to send some data to Server B. It will create a Ethernet Frame which has source MAC address (AAA) and destination MAC address ( BBB). The switch will build MAC address table and only learn from source MAC address. At this point, it just learned that MAC address of server A is on this interface and put that information in MAC address table. Since switch doesn’t know where server B , it has no option but to flood the frame to all the interface except from where it came from. Server B and C will receive the frame. Since Server B will see its MAC address as destination in the frame, it knows that frame is meant for him and Server C will discard it. Server B is going to respond to Server A, will build a frame with destination MAC address of A. At this point, switch will learn about MAC address and interface of Server B and will put it in MAC address table. That’s it, going forward any frame meant for server A or B will directly go to them. Server C will not see the frame except first time when switch flooded the frame on all its interface. One point worth mentioning that all mac address table uses an aging mechanism for its entries , so if MAC address of server A and B are not updated within its aging timer, they will be deleted.

VMware vSwitch : vSwitch doesn’t learn mac address from passing traffic. This goes for both standard and distributed vSwitch. It relies on the information that hypervisor( vmKernel) provides them about VM vNIC mac address. It knows that all vSwitch non uplink ports are used by VMs with known mac address. So a frame origination from a VM will be delivered to the right port if it is in the same vLAN and matches the destination mac address or send to the uplink. We can run the command “net-stats -l” from ESXi shell. This will print the mac address and port number of all the VMs on that ESXi host.

How to replace SSL certificate on Horizon Connection server

Below process only outline how to replace/change certificate on Horizon View Connection Server.

For process of generating request for certificate, we can refer to this KB article. https://kb.vmware.com/s/article/2068666

  1. RDP into connection server. Open up mmc.exe
  2. Click on File->Add/Remove Snap-in.
  3. Select Certificate->Add. In the pop up window, select Computer Account. In the next screen, keep selecting Local Computer and then click finish. Click ok.
  4. Expand Certificate and then Personal folder.
  5. Right Click on Personal->All tasks->Import. Browse Certificate file (.pfx )
  6. Put you password. Make sure to select Option “Mark this key as exportable“.
  7. Once finish. Message will pop up that import is successful. We can see newly imported certificate under Personal->Certificate folder in mmc.
  8. Rename the old certificate from vdm to any other name.
  9. Restart the connection server or just restarting horizon service by the name ‘ VMware Horizon View Connection Server ‘ from services.msc is sufficient for new certificate to take effect.

Few things to keep in mind while changing certificate:

a) We have to make certificate change individually one by one on all connection servers.

b)If the connection server(s) is behind Access point, we have to change thumbprint of connection server VIP on Access point by logging to each Access point. It can be changed under Horizon setting in the field ‘horizon connection server URL thumbprint’.

c) We don’t have view composer. This above method is for without view composer.

Why we started using Virtual volumes ?

With traditional virtual machines, a datastore is either a LUN (VMFS) or a volume (NFS).  VMDK is sitting on top of other file system ( VMFS or NFS ).  VVOLs can be considered as individual LUNs and VMDK are not sitting on any file system. Only file system is of guest operating system. There are many great articles online explaining in detail the architecture of VVOL. Putting a link to article below from VMware. Other that stood out to me is VMworld 2019 presentation on VVOL by VMware technical marketing team.

https://kb.vmware.com/s/article/2113013

Outlining below important reasons I think VVOL is useful:

  1. Monitoring Performance :  With VVOL, we can get insight of each VMDK of a VM in terms of IOPS, latency and Bandwidth.  As a result of this , it is easy to identify VM or VMDK with high storage usage and identify reasons for storage performance of a particular VM. More visibility to storage administrator on individual VM and individual VMDK.  In traditional environment, storage administrator have no visibility into what is on the LUN and hence on visibility on performance of a VM.   They had visibility into overall LUN performance but not individual VM. This results in better coordination between vSphere admin and storage admin in performance troubleshooting.
  2. Snapshot : With VVOL, snapshot will be done at array level. Obviously it will be faster.  In traditional method, vSphere snapshot is very robust too but it does have a performance impact.  With vSphere snapshot , it locks the original vmdk file and create delta file. Any changes further on goes to delta file and it keeps growing.  Performance is impacted because on the datastore there is file with extension .sh which is metadeta file . ESX host has to update the metadata file everytime the delta disk grows. Read goes to original baseline vmdk file. With VVOL, it creates the meta data when we create the snapshot of VM. There is no separate read and write disk like in vsphere snapshot. Deleting a snapshot is also a breeze , it just deletes the meta data. Overall, snapshot is much more efficient and fast with VVOL.
  3. Management: VVOL bring simplified management, scalability, smarter provisioing.  Both vSphere admin and storage admin don’t have to create and keep track of all LUNs or datastores. Storage admin just create a storage container which is technically allocating  logical quota of storage.  It helps storage admins in tracking the storage use and capacity planning.
  4. Storage Profile : Last but not least, is use of storage profile on individual VM or VMDK. It provides immense flexibility.  Though we don’t use storage profile at this point . I wouldn’t comment much on this. Something we are aiming to use in the future.

Basics of VM cpu cycle

A VM CPU is on one of these 4 states: Run, Ready, Co-Stop and Wait.

  1. Run – Run means VM is consuming CPU cycle. In other words, VMkernel has enough physical CPU cycle to give it to VM. We can see this counter from esxtop , under %run and also from vCenter GUI.
  2. Ready– Ready means VM is ready but it is not getting physical CPU cycle from VMkernel.
  3. Co-Stop– This state is only applicable to VMs with more than 1 vcpu. If VMkernel has only some of the CPUs, then it will run the VM partially. Eventually, there will be unbalanced and it will be stopped. The Co-Stop counter is increased to account for this.
  4. Wait-Wait means CPU is idle. It is not doing any work. Either it is really idle or waiting for IO.

Below is the diagram from the technical whitepaper “The CPU Scheduler in VMware vSphere® 5.1

Will HA and DRS work if vCenter goes down ?

DRS ( Distributed Resource Scheduler) does initial placement and balance VMs in a cluster based on the load. This feature is enabled at the cluster level.  DRS runs its algorithm once every 5 minutes ( by default) to study imbalance in the cluster . In each round, if it needs to balance the load, DRS uses vMotion to migrate running VMs from one ESXi host to another.

What if vCenter goes down , will DRS work ?

DRS recommendations are computed by vCenter service and it also initiates the vMotion process. Based on this , once vCenter goes down, DRS will not work and hence vMotion will also not work.

Please note , starting vsphere 7.0 update 1 , VMware has introduced vCLS VMs with intention of decoupling clustering services like DRS and HA from vcenter availability. Above statement still hold true for vcenter version prior to 7.0 U1.

HA ( High Availability) is also enabled at cluster level.  HA works on principal of master and slave hosts in the cluster and fdm agents running on each ESX server to communicate status of its availability. It depends on heartbeat via network and datastore to ensure availability.  vCenter is just used to activate and deactivate HA. If vcenter goes down, HA will work as it was planned.  But for making any changes at HA like admission control, etc , we would be needing vCenter backup and running.