A useful tool from Microsoft

Quick synopsis: Recently while using Microsoft SCCM to upgrade splunk agents on windows severs, ran into issue where appenforce logs were showing upgraded agent is installed but i didn’t see anything installed in control panel. Long story short, something was messed up. Came across this tool from Microsoft to properly cleanup the installed agent before doing a fresh install or upgrade. Just a disclaimer, i have basic level understanding and knowledge of SCCM and recently started using it for this purpose, so for others this may be already known. Just posting it here for my record.

Link to the MS tool below:

https://support.microsoft.com/en-us/help/17588/windows-fix-problems-that-block-programs-being-installed-or-removed

Steps were simple:

  1. Download and run this tool.
  2. Select Uninstall.
  3. Select “universal forwarder”
  4. Uninstall.
  5. Once done, i could resume my activity of installing via SCCM.
What is %cstp or co-stop ?

The %cstp value is the time vCPU is stopped from executing while waiting for other vCPU’s in the same virtual machine to execute/catch up. With this definition, cstop is not applicable to VMs with 1 vcpu.

Users have this conception that increasing the vcpu will increase the performance of VM. While this is true in many cases but not everytime. In this case, it becomes all the more important to understand the role of cstp and its acceptable value.

When the VM is ready to be executed, all of allocated vcpu need to be schedule togetheri.e. CPU scheduler  cannot schedule 2 out of 4 VCPUs of a VM to start executing the threads. A guest operating system requires synchronous progress on all its CPUs, otherwise the OS and application will crash or fail. As one can imagine this being similar to taking out a CPU or one of the CPUs allocated had a failure.

In order to ensure that such workloads are not impacted even if the underlying cores are severely constrained, the CPU scheduler places the VM in a Co-Stop(CSTP) state.

This ofcourse can have adverse effect on the performance and is reflected as CSTP value being high.

%cstp value shouldn’t be higher than 3%. If it is generally higher than that then it may be that the VM has too many vCPU

Should we enable hot add feature ?

We have not enabled this feature though this provides lot of flexibility in upgrading the resources. Simple reason is enabling this feature disables NUMA. That brings the second question why should we care about NUMA ?

What is NUMA ?

The best explanation about NUMA is i think on this site.

https://www.exitthefastlane.com/2016/04/vsphere-design-for-numa-architecture.html

In very simple explanation, to design your virtual environment to be NUMA aligned means ensuring that your VMs receive vCPUs and RAM tied to a single physical CPU (pCPU), thus ensuring the memory and pCPU cores they access are directly connected and not accessed via traversal of a CPU interconnect.

A good basic understanding of NUMA can help administrator or solution architect in:

  1. Right sizing a VM in terms of cpu and memory.
  2. Avoid potential performance issue on heavy hitter applications running on big size VMs.
  3. Gently push back on DBA for demanding more resources on DB VMs with logical explantion of benefits of remaining within vNUMA node and more is not always good. ( DBA is just example i took to explain my point, can be any).
  4. Just a thought, can be potentially good interview question also.

How to quickly find VMs rebooted due to VMware HA.

Recently we ran into issue where business quickly demanded name of VMs which were rebooted due to HA. There are few ways to do it. Outlining below 2 methods to do that. First method is via simple powercli script and second method is via VM uptime gathered from vcenter.

First method.

Every VM rebooted due to HA has an event generated against it. Below one liner code find that VM and output that result in csv file. Here, i am assuming you know how to run the powercli code. I am not going into that detail, just keeping it high level.

Get-VIEvent -Entity VM -MaxSamples 10000 -Start(Get-Date).AddDays(-1) -Type Warning | where {$_.FullFormattedMessage -match “vSphere HA restarted virtual machine”} | Select ObjectName,CreatedTime,FullFormattedMessage | sort CreatedTime -Descending | Export-Csv -Path “C:\impactedvmslist1.csv” -NoTypeInformation

Second Method:

This method is quick but may not give most accurate information depending upon your environment and cluster size. This involves looking at VMs uptime from vcenter which you can corelate with when that HA happened.

  • Click on Cluster on which host failed and HA happened.
  • Click on VMs tab.
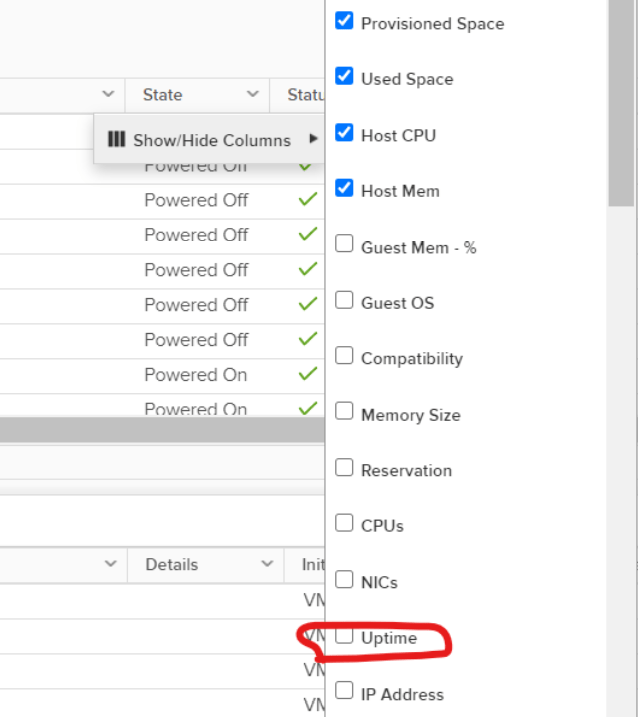
  • If you don’t see uptime tab , then it is hidden.
  • You can unhide(show) uptime tab as below.